Monitoring Setup
This guide walks you through setting up comprehensive monitoring for OSO Kafka Backup using Prometheus and Grafana.
Overview
OSO Kafka Backup exposes Prometheus metrics at /metrics endpoint, enabling you to:
- Track backup progress and throughput
- Monitor consumer lag per partition
- Measure storage write latency
- Alert on errors and performance issues
Quick Start with Docker
The fastest way to get started is using the provided Docker Compose stack.
Prerequisites
- Docker and Docker Compose installed
- OSO Kafka Backup running with metrics enabled
Start the Monitoring Stack
# Clone the repository (if you haven't already)
git clone https://github.com/osodevops/kafka-backup.git
cd kafka-backup

# Start the monitoring stack
cd docker
docker-compose -f docker-compose.metrics.yml up -d
This starts:
| Service | URL | Description |
|---|---|---|
| Prometheus | http://localhost:9090 | Metrics collection and querying |
| Grafana | http://localhost:3000 | Visualization dashboards |
| Mimir | http://localhost:9009 | Long-term metrics storage |
Access Grafana
- Open http://localhost:3000
- Login with
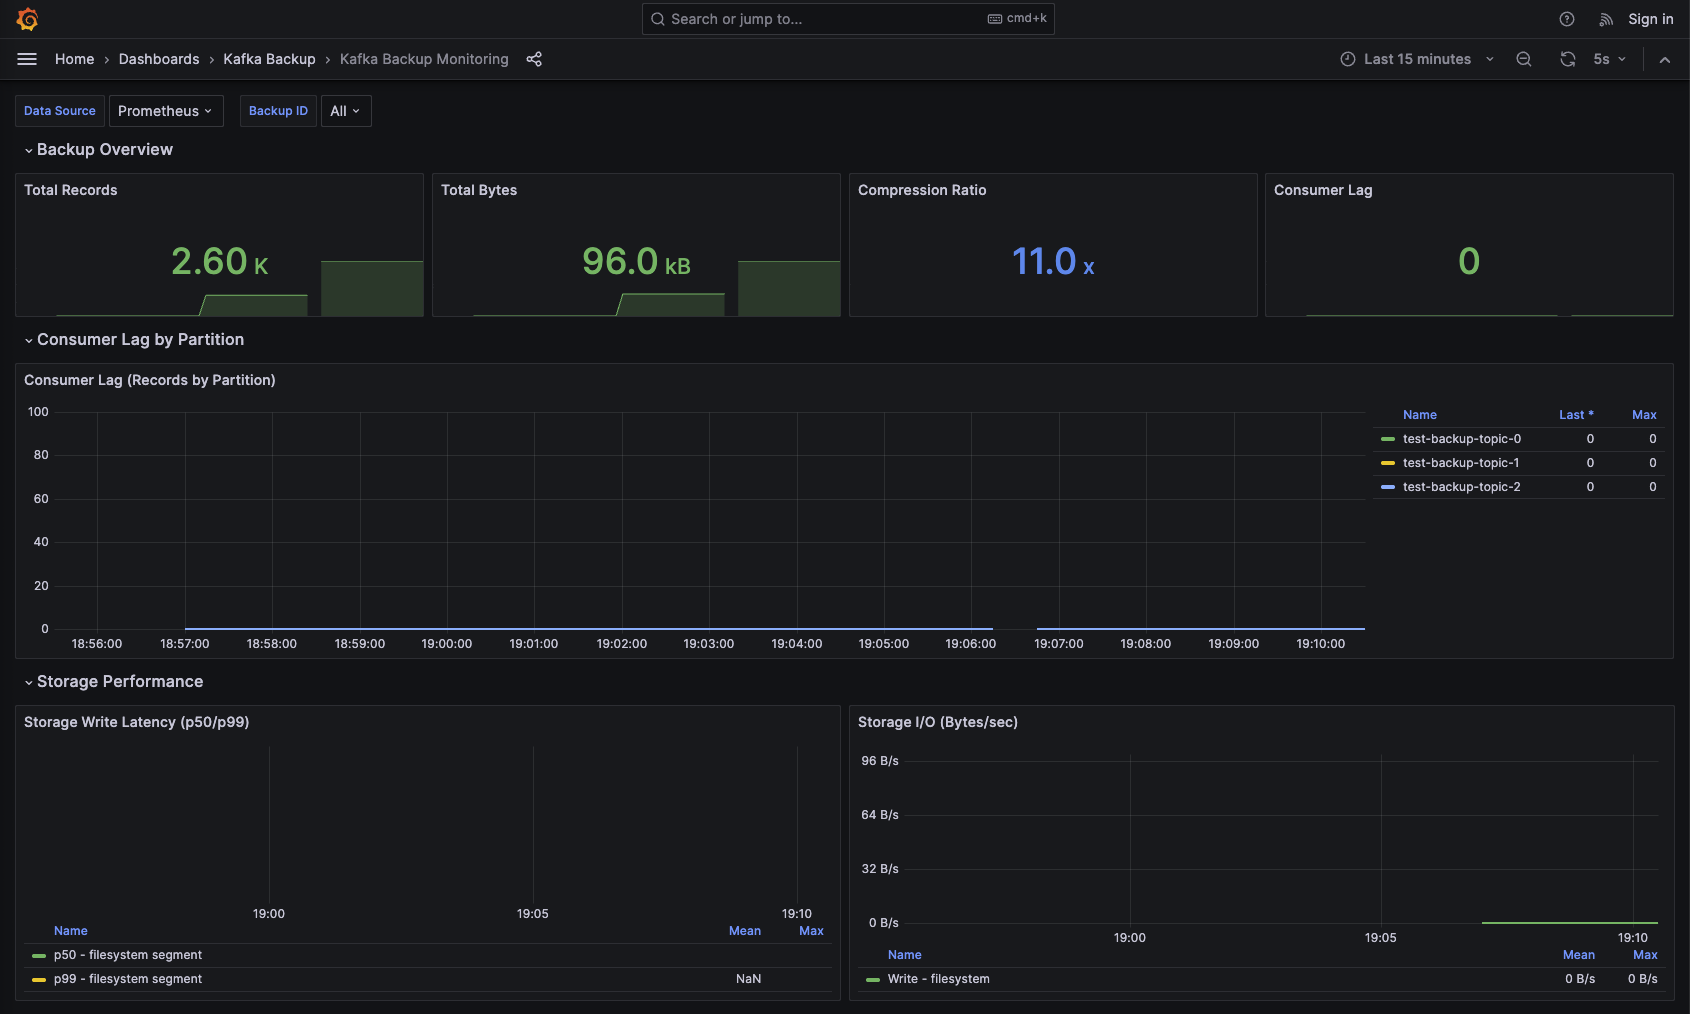
admin/admin - Navigate to Dashboards → Kafka Backup Monitoring
The dashboard is automatically provisioned with panels for all key metrics.
Docker Compose Configuration
Here's the complete docker-compose.metrics.yml:
version: '3.8'

services:
  prometheus:
    image: prom/prometheus:v2.48.0
    container_name: kafka-backup-prometheus
    ports:
      - "9090:9090"
    volumes:
      - ./prometheus/prometheus.yml:/etc/prometheus/prometheus.yml:ro
      - prometheus-data:/prometheus
    command:
      - '--config.file=/etc/prometheus/prometheus.yml'
      - '--storage.tsdb.path=/prometheus'
      - '--web.enable-lifecycle'
    extra_hosts:
      - "host.docker.internal:host-gateway"

  grafana:
    image: grafana/grafana:10.2.2
    container_name: kafka-backup-grafana
    ports:
      - "3000:3000"
    environment:
      - GF_SECURITY_ADMIN_PASSWORD=admin
      - GF_USERS_ALLOW_SIGN_UP=false
    volumes:
      - ./grafana/provisioning:/etc/grafana/provisioning:ro
      - grafana-data:/var/lib/grafana
    depends_on:
      - prometheus

  mimir:
    image: grafana/mimir:2.11.0
    container_name: kafka-backup-mimir
    ports:
      - "9009:9009"
    volumes:
      - ./mimir/mimir.yaml:/etc/mimir/mimir.yaml:ro
      - mimir-data:/data
    command:
      - '--config.file=/etc/mimir/mimir.yaml'

volumes:
  prometheus-data:
  grafana-data:
  mimir-data:
Prometheus Configuration
Create prometheus/prometheus.yml:
global:
  scrape_interval: 15s
  evaluation_interval: 15s

scrape_configs:
  - job_name: 'kafka-backup'
    static_configs:
      - targets: ['host.docker.internal:8080']
    scrape_interval: 5s
    metrics_path: /metrics
host.docker.internal allows Prometheus running in Docker to scrape metrics from kafka-backup running on the host machine.
Grafana Dashboard
The pre-built dashboard includes these panels:
Overview Row
| Panel | Metric | Description |
|---|---|---|
| Total Records | kafka_backup_records_total_total | Running count of backed up records |
| Total Bytes | kafka_backup_bytes_total_total | Total bytes processed |
| Compression Ratio | kafka_backup_compression_ratio | Current compression efficiency (higher is better) |
| Consumer Lag | sum(kafka_backup_lag_records) | Total records behind high watermark |
Consumer Lag Row
| Panel | Description |
|---|---|
| Consumer Lag by Partition | Time series showing lag per topic/partition |
Storage Performance Row
| Panel | Metric | Description |
|---|---|---|
| Storage Write Latency | kafka_backup_storage_write_latency_seconds | p50 and p99 write latency |
| Storage I/O | kafka_backup_storage_write_bytes_total_total | Bytes per second written |
Manual Prometheus Setup
If you're not using Docker, configure Prometheus to scrape kafka-backup:
Static Target
# prometheus.yml
scrape_configs:
  - job_name: 'kafka-backup'
    static_configs:
      - targets: ['kafka-backup-host:8080']
    scrape_interval: 15s
Kubernetes Service Discovery
# prometheus.yml
scrape_configs:
  - job_name: 'kafka-backup'
    kubernetes_sd_configs:
      - role: pod
    relabel_configs:
      - source_labels: [__meta_kubernetes_pod_label_app]
        regex: kafka-backup
        action: keep
      - source_labels: [__meta_kubernetes_pod_container_port_number]
        regex: "8080"
        action: keep
ServiceMonitor (Prometheus Operator)
apiVersion: monitoring.coreos.com/v1
kind: ServiceMonitor
metadata:
  name: kafka-backup
  labels:
    release: prometheus
spec:
  selector:
    matchLabels:
      app: kafka-backup
  endpoints:
    - port: metrics
      interval: 15s
      path: /metrics
Enable Metrics in kafka-backup
Add the metrics configuration to your backup config:
# backup.yaml
backup_id: "production-backup"

source:
  bootstrap_servers: ["kafka:9092"]
  topics:
    include: ["orders", "events"]

storage:
  backend: s3
  bucket: my-kafka-backups

# Enable metrics endpoint
metrics:
  enabled: true
  port: 8080
  bind_address: "0.0.0.0"
Run the backup:
kafka-backup backup --config backup.yaml
Verify metrics are exposed:
curl http://localhost:8080/metrics
Quick Monitoring with CLI
For quick status checks without setting up Prometheus/Grafana, use the built-in status watch command:
# One-shot status check
kafka-backup status --config backup.yaml

# Continuous monitoring (refreshes every 2 seconds)
kafka-backup status --config backup.yaml --watch

# Custom refresh interval
kafka-backup status --config backup.yaml --watch --interval 5
Example output:
================================================================
  OSO Kafka Backup - Live Status
================================================================
  Backup ID: production-backup                    Uptime: 00:15:32
  Status: RUNNING
================================================================
  Progress
  |- Records: 1,234,567
  |- Bytes: 256.0 MB (compressed)
  |- Throughput: 15234 rec/s | 3.2 MB/s
  |- Lag: 45,000 records (orders-0)
================================================================
  Components
  |- kafka:            [OK] ok
  |- storage:          [OK] ok
================================================================
  Compression: 3.2x ratio | Errors: 0
================================================================
  Last updated: 2025-01-30 14:32:15 | Refresh: 2s | Ctrl+C to exit
This is useful for:
- Quick debugging during development
- Verifying backup is running correctly
- Ad-hoc monitoring in CI/CD pipelines
- Environments where Prometheus isn't available
Key Metrics to Monitor
Backup Health
# Records being backed up (should be > 0 during active backup)
rate(kafka_backup_records_total_total[5m])

# Consumer lag (should trend toward 0)
sum(kafka_backup_lag_records)

# Error rate (should be 0)
rate(kafka_backup_errors_total_total[5m])
Performance
# Storage write latency p99
histogram_quantile(0.99, rate(kafka_backup_storage_write_latency_seconds_bucket[5m]))

# Throughput in bytes/sec
rate(kafka_backup_bytes_total_total[5m])

# Compression ratio
kafka_backup_compression_ratio
Alert Rules
Add these to your Prometheus alerting rules:
groups:
  - name: kafka-backup-alerts
    rules:
      # Alert if backup is lagging significantly
      - alert: KafkaBackupLagging
        expr: sum(kafka_backup_lag_records) > 100000
        for: 10m
        labels:
          severity: warning
        annotations:
          summary: "Kafka backup is lagging"
          description: "Backup is {{ $value }} records behind"

      # Alert on any errors
      - alert: KafkaBackupErrors
        expr: increase(kafka_backup_errors_total_total[5m]) > 0
        for: 1m
        labels:
          severity: critical
        annotations:
          summary: "Kafka backup errors detected"
          description: "{{ $labels.error_type }} errors in backup {{ $labels.backup_id }}"

      # Alert if backup appears stalled
      - alert: KafkaBackupStalled
        expr: |
          increase(kafka_backup_records_total_total[10m]) == 0
          and kafka_backup_lag_records > 0
        for: 15m
        labels:
          severity: critical
        annotations:
          summary: "Kafka backup appears stalled"
          description: "No records processed but lag exists"

      # Alert on high storage latency
      - alert: KafkaBackupStorageLatencyHigh
        expr: |
          histogram_quantile(0.99,
            rate(kafka_backup_storage_write_latency_seconds_bucket[5m])
          ) > 5
        for: 5m
        labels:
          severity: warning
        annotations:
          summary: "Storage write latency is high"
          description: "p99 latency is {{ $value }}s"
Grafana Alert Integration
To receive alerts in Grafana:
- Go to Alerting → Contact Points
- Add your notification channel (Slack, PagerDuty, email, etc.)
- Create alert rules based on the PromQL queries above
Troubleshooting
Metrics endpoint not responding
# Check if kafka-backup is running
ps aux | grep kafka-backup

# Check if port is listening
lsof -i :8080

# Test endpoint
curl -v http://localhost:8080/metrics
Prometheus not scraping
# Check Prometheus targets
curl http://localhost:9090/api/v1/targets

# Look for kafka-backup target and check "lastError"
No data in Grafana
- Check Prometheus is scraping: http://localhost:9090/targets
- Query directly in Prometheus: http://localhost:9090/graph
- Verify data source in Grafana: Configuration → Data Sources → Prometheus → Test
Next Steps
- Metrics Reference - Complete metrics documentation
- Performance Tuning - Optimize based on metrics
- Troubleshooting - Debug with metrics